|
By David McWilliams
December 23, 2017 At school, our Religion teacher, a wise Catholic priest known as ‘Doc Carroll’, urged us to read St Thomas Aquinas on sinfulness. As you can imagine, in an Irish Catholic boarding school, sin was a big deal. The 1980’s moral tug of war for my soul pitted Aquinas at Mass against Bananarama on Top of the Pops. Guess who won? However, Aquinas has proved more enduring. I can only remember Bananarama chorus lines after too much wine at 50th parties (not pretty); but Aquinas’ observations have stayed with me. He believed in the idea of a ‘just price’ whereby a ‘good man’ shouldn’t knowingly sell anything for more than it was worth and, under no circumstance, should he lend money for interest to anyone. Usury was a clear sin; absolution from this crime demanded deep penance as the common or garden “a dozen Our Fathers and hail Mary’s” wouldn’t suffice. In Thomas’ world, speculation was a venial sin and using borrowed money to speculate verged towards a mortal sin. Of course, the reason the great Catholic philosopher was interested in money is because he was interested in human nature and how money affects human nature. He was also interested in the flock or the herd: anything that moves the herd in a certain direction needs to be watched, and speculation (especially leveraged speculation) does strange things to the herd. The word speculation comes from the Latin ‘speculare’ which is to be on the look out for trouble. The Roman forum with its whores, thieves and moneychangers, had a special corner reserved for the speculari. They’ve been around for a long time. Bulls and bears have long dominated markets, manipulating human nature and undermining rationality in the pursuit of riches. When other peoples’ money is cheap, the incentive to borrow to drive up prices and sell on to the next guy, pocketing the difference, is as old as humanity itself. But as Aquinas understood, speculating is a very different business to investing. In a nutshell, the speculator starts with a small amount of money, hoping to make a lot, quickly. The investor, in contrast, starts with a lot of money and hopes to make a little more, slowly. It’s all around us Innovation has always excited the speculator, so too has cheap money. Although investments are subject to wasteful booms and busts, it doesn’t mean they are useless. Many innovations that have been the subject of wild speculation have lasted or had a profoundly positive effect on the productivity of the economy. Speculation isn’t useless but it is dangerous and with leverage it can link bits of the global economy, which otherwise have no obvious connection. The legacy of various speculative manias is all around us. For example, I live in a truncated terrace of houses built just after the Napoleonic Wars when Dublin and the rest of urban Britain was in the grip of a building boom. The boom was fuelled by paper profits generated by exotic investment in the first emerging markets mania. Following British victories over France, the colonies were seen as a place to make fortunes – which in some cases they were. Once the war was won, yields on British government bonds (Consols) collapsed and interest rates fell dramatically. Between 1820 and 1824, powered by the confidence that followed the military victory abroad and rock bottom interest rates at home, local speculators played the arbitrage between the paltry yields on British Consols and the stellar yields of colonial debt. Colonial projects promised vast fortunes. Punters piled in. Banks lent using existing colonial debt as collateral, encouraged by the exciting mathematics of notional arbitrage. This is a common feature of many booms. The bank’s balance sheet plays tricks on itself, whereby expensive collateral is mistaken for good collateral. Money gushed into the system, linking for the first time, credit with the business cycle. Up to the 1800s, wars and agriculture drove the vagaries of the business cycle. Once credit emerged, it came to dominate the business cycle. The modern cycle, whereby credit begets credit, first emerged in the 1820s. In 1825, the Bank of England, fearing that asset price inflation was getting out of control, raised rates and the highly leveraged, post Napoleonic boom came crashing down, driving banks to the wall. Building on the terrace where I live was stopped as the developer went bust. Things that last As I write, looking out the window over Dun Laoghaire harbour towards Wales, Dublin’s only efficient metropolitan railway trundles reliably along just across the road, hugging the coastline. This line was one of the world’s first suburban railways, completed in 1834 to whisk the wealthy Victorians out from the fetid city centre to the refreshing air of the seaside. Following the emerging markets crisis of 1825, the next big financial boom in these parts revolved around railways. The first railway boom, or ‘railway fever’ as it was called at the time, broke out just after the 1825 crash with the opening of the Stockport / Darlington line. In no time – and again driven by easier monetary conditions after the crash – ‘railway fever’ engulfed both islands, with Liverpool, Manchester and Dublin vying to match London’s enthusiasm for new railway companies. Not unlike the dotcom boom a few years back and today’s tech boom, the technological revolution wrought by the railways was real. It brought massive social change. The 1840s and 1850s witnessed a speculative mania like no other in terms of participation and excitement. Railways captured the imagination of all with the promise of cheap transport for the masses, opening up the countryside and connecting people like never before. It’s hard to overstate the impact of cheap transport on a society where up to then, a significant proportion of the population had barely travelled more than a few miles beyond their own villages. The place was giddy with railway exhilaration. As more lines were laid, more railway shares were issued and more and more people were sucked into the financial vortex. John Mills, head of the Manchester Statistical Society, looked back at the railway boom in the 1860s and noted that “Panics do not destroy capital; they merely reveal the extent to which it has been previously destroyed by its betrayal into hopelessly unproductive works.” Railways were the future but they still had to make money. Mass transport means cheap transport and the cheaper the tickets the more compromised the revenue stream of the newer lines, which were being built in more and more remote places. In time, the disparity between the soaring speculative share prices buoyed up by ever increasing leverage and the underlying modest profitability of many of the lines themselves, coaxed some to take profits. The very psychological act of defiance that is selling early, undermines the shaky edifice of the boom. In the end, the railway boom came to a shuddering halt weighed down by its own internal contradictions between price and value. As always, value elbows its way into the speculative group trip and wrecks the buzz. That’s not to say the railway mania was an irrelevant wasteful period in our history. Not at all. In fact, after I finish writing this I’m going to hop on a new train on the old Victorian line into the city. But the point is that boom and bust cycles tend to follow similar paths. The most expensive four words of all are: “This time it’s different”. Credit cycles, as Thomas Aquinas understood, are part of human nature. Boom / bust episodes do strange things to us. It is easy to be caught up in the effervescence, misdiagnosing flakey speculation in the asset of the moment for a solid long-term investment. The Kindleberger / Minsky framework When thinking about asset bubbles, I frequently turn to the work of two economists whose work on credit bubbles, booms and busts seems, to me, extremely accurate. Charles Kindleberger and Hyman Minsky, rejecting classical economics that took the irrational human out of the equation, both recognised the importance of the human propensity to panic, indulge in herd behavior and believe our own propaganda. They outlined the stages of a credit boom, where investors go from optimism and euphoria to depression and panic – a journey that leads to the destruction of wealth. Like Aquinas, they understood human nature. Because we are a flock or a herd, we are essentially pro-cyclical. That is why we tend to act in ways that reinforce whatever economic trend prevails at a given time. In other words, most people are what is known in financial markets as ‘momentum investors’, who follow the crowd, buoyed up by the excitement of it all, rather than value investors who are constantly asking themselves whether prices are reflecting real value or something else. The predominance of momentum investors has the effect of amplifying the high and low points of cycles. It is this sort of behaviour that leads to bubbles and can also push the economy out of kilter for long periods of time. It is simply not true that the self-interested economy naturally rights itself and finds equilibrium. In fact, the opposite is the case. The self interest of banks, market players and leveraged speculators can lead the economy to long inflationary periods or can find itself stuck in long periods of unemployment and deficient demand. Kindleberger’s seminal work – Manias, Panics and Crashes – is well worth a read over Christmas. In it he rejects two widely-held views in classical economics: that financial markets are efficient and that people are rational. He quotes Isaac Newton, who lost a small fortune on the great 18th century speculative punt, the South Sea Bubble, “I can calculate the motions of heavenly bodies but not the madness of crowds”. Kindleberger observed that panic can be sparked by a relatively trivial event. Once there is leverage in the system, small events have the tendency to become amplified, particularly if there is no hegemon that will backstop the system when a panic occurs. Such a hegemon in a financial crisis is a large active central bank with sufficient ammunition to mollify the panic. If a panic occurs when rates are high and unorthodox monetary policy has not been used, the central bank’s powder is dry so to speak. But today, after nearly a decade of QE, this is not the case. Looking at the Great Depression and sharing some of Kindleberger’s analysis, Minsky observed how the financial system can go from rude health to fragility extremely quickly. He also identified the five sequential stages of a credit crisis: (1) displacement; (2) boom; (3) euphoria; (4) profit-taking and (5) panic. At the beginning something real happens to displace or disrupt the old order and replace it with something new. This can be a monetary event like the ZIRP or QE where monetary conditions are changed dramatically. This has a real impact on valuations. The displacement or disruption can also be an innovation, which changes the market, such as the emergence of railways, the Internet, Amazon or Uber. Prices of assets start to rise rapidly and people who usually remain aloof from these events become involved. The boom period leads to gearing as the banks fall over themselves to get involved. The next stage is euphoria, when the herd gets excited. This is when balance sheets play tricks on both lenders and borrowers. But of course success breeds a healthy disregard for the chances of failure. The thundering herd is galloping. During the euphoria stage, leverage amplifies prices. At these lofty levels, some savvy players take this as a signal to cash in their chips. A prescient few take profits. This begins the process of unraveling when the herd realises that prices are falling and, in an effort to get out, everyone rushes for the door in panic. The edifice collapses, fortunes are lost and we start again. The essence of a credit cycle is a debt build up combined with old fashioned human nature fueling humanity’s pathological optimism as we end up believing our own propaganda. Minsky made another crucial observation which helps us to understand panics; it is important to look at the types of borrowers who obtain financing during a boom. There are the ‘hedge borrowers’ who can finance their borrowings, both the capital and the interest, out of their own income. Then there are the ‘speculative borrowers’ who can finance the interest on their borrowing but need to roll over the principal. Finally, there are the ‘Ponzi borrowers’ who can’t afford the interest or principal; only the rising value of the asset makes their investments viable. In this type of deal, money doesn’t change hands. The Ponzi borrowers buy ‘on paper’ and sell ‘on paper’ and if the market goes up quick enough they make a tidy killing. If the market falls, they are goosed and so too are those who lent to the Ponzi borrowers! When the bubble pops, the first guy to fall is the Ponzi borrower – but it doesn’t stop there. The generalised fall in asset prices affects the speculative borrower too, because the bank will only allow him to rollover the principal if the asset has value; if the asset value falls, the bank slams on the brakes. As the withdrawal of credit causes the economy to seize up, everyone’s income falls. This affects even the hedge borrower’s position because although he could finance both interest and capital out of income, as everyone’s income is falling, his is too, making it difficult for even the hedge borrower to meet his payments. As markets go ever higher and the gap between valuation and prices becomes more and more stretched, it would seem injudicious to ignore the repeated warnings from history and overlook our human capacity for individual and collective self-delusion. At Christmas time, even the faithful could do with a little self-doubt. by Mark Spitznagel September 23, 2016 Barron's We are living through truly unprecedented, risky times for investors. Certainly, global markets have never been more distorted by central bank manipulations than they are today, and investors can only hope that such manipulations will miraculously avoid ending in yet another catastrophic financial crisis. It is natural that so-called safe haven investments currently seem to be on everyone’s minds, and it is timely to ask the question: Just what makes a safe haven a safe haven? And what’s the best one out there? As someone who’s spent his life trying to create just that, here’s my take. Clearly, the point of any safe haven investment comes down to one thing: protecting real economic value in a portfolio against economic catastrophe. This is both a defensive measure to avert future loss, and an offensive one to exploit future opportunities (with “dry powder”). While we often think of safe havens as merely protecting the capital invested directly in them, they are actually meant to do so much more. Rather than a well-timed place to hide away most of a portfolio, most investors appropriately think about a safe haven as a rather small, tactical allocation that indirectly provides protection to capital invested elsewhere in a portfolio. This requires a lot of bang for the buck from that small allocation. So a safe haven needs to be a highly nonlinear, insurance-like hedge that explodes in value whenever systemic markets crash. In fact, the better a safe haven is at providing this insurance-like protection payoff, the better it serves its purpose. Specifically, the best safe havens both provide the highest and most reliable protective profit in a systemic crash, as well as have the greatest difference between their range of crash profit and their range of non-crash loss. The key here is, the better this insurance protection, the less capital is needed for the safe haven, the less portfolio drag from any of its losses, and the more return is available during more benign times from presumably more productive investments elsewhere in the portfolio. Paradoxically, what makes a safe haven the best safe haven is how much of it you don’t need in order to stay safe. Let’s take a look at the historical ranges of profit and loss in various safe haven investments through different environments in hopes of determining the best safe haven out there. I’ll use the S&P 500 stock index as a proxy for the systemic risks that investors will likely want protection from with a safe haven, and I’ll bucket historical annual returns of different safe havens by corresponding annual S&P 500 total returns. (I’m using less statistically-significant annual returns because higher frequency data tend to obscure the economically meaningful nonlinear relationships I’m looking for here.) Below are the conventional time-honored safe havens of gold, the Swiss franc and US treasuries, as well as a less conventional and somewhat more exotic safe haven of an equity tail hedge. Look at the high, low, and average of each bucket. 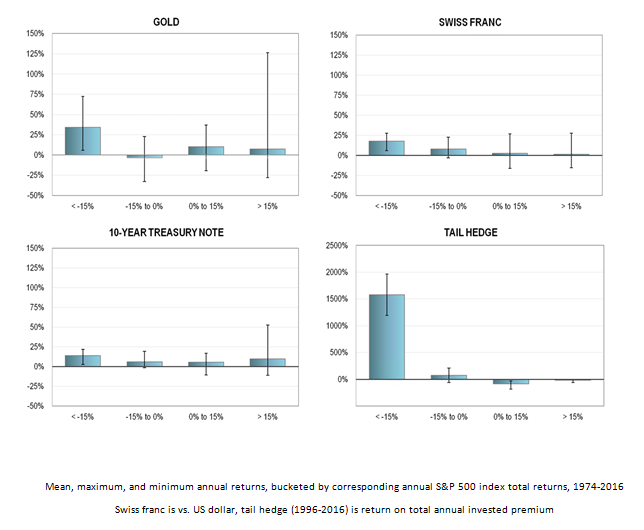 Notice that, since 1974, whenever stocks were down by over 15% in any given year (a “tail event,” as there were only three such occurrences), gold returns ranged from about +70% to +5%, with an average of just over +30%—by far the best protection of the lot. In all other years, its returns ranged from +125% to -30%, with an average of under 7%. These are pretty good insurance-like returns, especially the average returns. The problem seems to be the volatile ranges around these average returns, particularly considering the amount of gold needed in our portfolio for an effective hedge. If we expect gold to make about 30% in a -20% stock market crash, we would need a gold allocation of two-thirds the size of our equity allocation in order to fully protect that equity position. With this size, we would actually be adding noise and potential drag to our portfolio in non-crash years, and even in the crash years, gold might do very little this time around. (I doubt it, but who knows?) This is like skydiving with a parachute that may or may not deploy; you’d be better off having no parachute at all, so a more informed decision can be made whether or not to jump. You can see how the degrees and reliability of the protection and insurance-like feature are the keys to the safe haven.
Still, gold looks pretty golden among the first three safe havens in our group. In fact, by our insurance protection criteria, it’s the only safe haven among them. The others show meager protection or meager to non-existent insurance-like payoffs or both. I needn’t even mention the obvious transformations over the years that have left their safe haven status even more unreliable—such as low treasury yields with little room left to fall (though lots to rise) and the sad monetary degradation of the Swiss franc. Gold’s millennia of safe haven attributes, however, remain very much intact. (I am ignoring many other so-called safe havens, such as high dividend-paying stocks, hedge funds, fine art, and US farmland, because their crash returns are very low—in the case of the first three, even negative; they simply do not provide any insurance protection.) The fourth safe haven in our graph, the equity tail hedge, demonstrates what an extreme case of explosive protection and nonlinearity can look like. This generic tail hedge strategy—a cartoonish simplification, for sure—just spends a fixed amount of capital each month on way-out-of-the-money four-month puts on S&P 500 futures (with a straightforward constraint to avoid the priciest options) and mechanically “delta-hedges” them; the puts are kept until expiration or sold if they explode to a ridiculously high level. Pretty basic stuff, really. The data in the buckets are the annual returns on total capital invested in puts over any given year. (VIX futures might have been a simpler alternative to this tail hedge strategy, though it just started trading in 2004 and furthermore its popularity has lead to a very costly, steep “roll”, making it a real stinker of a trade.) We don’t need to allocate much capital to these puts to protect our equity allocation—less than a couple percent of that equity allocation per year, since they make over 1500% when the S&P is down over 15%! When there’s no crash, the capital you expect to lose on these puts when they expire worthless is much smaller than what you’ve likely gained by allocating more to other more risky stuff like equities. This superior insurance protection profile of the tail hedge shouldn’t be too surprising, since we’re bucketing by the very same underlier of the puts. But it shows the benefits of being direct and not too cute in our choice of a safe haven. This parachute is the most likely to deploy. Not all safe haven investments are created equal. Based on our insurance protection criteria, there are but two safe havens truly worthy of the name: gold and an equity tail hedge. They are in many ways functionally equivalent, as both hedge the same systemic tails—specifically bursting bubbles. This is really good news for mom-and-pop investors, as they have ready access to gold , if not so much to derivatives. ((There are gold ETFs such as the SPDR Gold Trust (GLD), however they come with significant risk of not enough physical gold backing the paper; there’s also physical gold itself of course, which comes with the complexities of storage.) What I’ve shown is just that, my own bias aside, an equity tail hedge (in the specific form depicted here) happens to provide much more explosive and reliable insurance-like protection; it is the one safe haven that is as good as—and even better than—gold. by Robert J. Shiller
NY Times 19 October, 2017 Oct. 19, 1987, was one of the worst days in stock market history. Thirty years later, it would be comforting to believe it couldn’t happen again. Yet that’s true only in the narrowest sense: Regulatory and technological change has made an exact repeat of that terrible day impossible. We are still at risk, however, because fundamentally, that market crash was a mass stampede set off through viral contagion. That kind of panic can certainly happen again. I base this sobering conclusion on my own research. (I won a Nobel Memorial Prize in Economic Sciences in 2013, partly for my work on the market impact of social psychology.) I sent out thousands of questionnaires to investors within four days of the 1987 crash, motivated by the belief that we will never understand such events unless we ask people for the reasons for their actions, and for the thoughts and emotions associated with them. From this perspective, I believe a rough analogy for that 1987 market collapse can be found in another event — the panic of Aug. 28, 2016, at Los Angeles International Airport, when people believed erroneously that they were in grave danger. False reports of gunfire at the airport — in an era in which shootings in large crowds had already occurred — set some people running for the exits. Once the panic began, others ran, too. That is essentially what I found to have happened 30 years ago in the stock market. By late in the afternoon of Oct. 19, the momentous nature of that day was already clear: The stock market had fallen more than 20 percent. It was the biggest one-day drop, in percentage terms, in the annals of the modern American market. I realized at once that this was a once-in-a lifetime research opportunity. So I worked late that night and the next, designing a questionnaire that would reveal investors’ true thinking. Those were the days before widespread use of the internet, so I relied on paper and ink and old-fashioned snail mail. Within four days, I had mailed out 3,250 questionnaires to a broad range of individual and institutional investors. The response rate was 33 percent, and the survey provided a wealth of information. My findings focused on psychological data and differed sharply from those of the official explanations embodied in the report of the Brady Commission — the task force set up by President Ronald Reagan and chaired by Nicholas F. Brady, who would go on to become Treasury secretary. The commission pinned the crash on causes like the high merchandise trade deficit of that era, and on a tax proposal that might have made some corporate takeovers less likely. The report went on to say that the “initial decline ignited mechanical, price-insensitive selling by a number of institutions employing portfolio insurance strategies and a small number of mutual fund groups reacting to redemptions.” Portfolio insurance, invented in the 1970s by Hayne Leland and Mark Rubinstein, two economists from the University of California, Berkeley, is a phrase we don’t hear much anymore, but it received a lot of the blame for Oct. 19, 1987. Portfolio insurance was often described as a form of program trading: It would cause the automatic selling of stock futures when prices fell and, indirectly, set off the selling of stocks themselves. That would protect the seller but exacerbate the price decline. The Brady Commission found that portfolio insurance accounted for substantial selling on Oct. 19, but the commission could not know how much of this selling would have happened in a different form if portfolio insurance had never been invented. In fact, portfolio insurance was just a repackaged version of the age-old practice of selling when the market started to fall. With hindsight, it’s clear that it was neither a breakthrough discovery nor the main cause of the decline. Ultimately, I believe we need to focus on the people who adopted the technology and who really drove prices down, not on the computers. Portfolio insurance had a major role in another sense, though: A narrative spread before Oct. 19 that it was dangerous, and fear of portfolio insurance may have been more important than the program trading itself. On Oct. 12, for instance, The Wall Street Journal said portfolio insurance could start a “huge slide in stock prices that feeds on itself” and could “put the market into a tailspin.” And on Saturday, Oct. 17, two days before the crash, The New York Times said portfolio insurance could push “slides into scary falls.” Such stories may have inclined many investors to think that other investors would sell if the market started to head down, encouraging a cascade. In reality, my own survey showed, traditional stop-loss orders actually were reported to have been used by twice as many institutional investors as the more trendy portfolio insurance. In that survey, I asked respondents to evaluate a list of news articles that appeared in the days before the market collapse, and to add articles that were on their minds on that day. I asked how important these were to “you personally,” as opposed to “how others thought about them.” What is fascinating about their answers is what was missing from them: Nothing about market fundamentals stood out as a justification for widespread selling or for staying out of the market instead of buying on the dip. (Such purchases would have bolstered share prices.) Furthermore, individual assessments of news articles bore little relation to whether people bought or sold stocks that day. Instead, it appears that a powerful narrative of impending market decline was already embedded in many minds. Stock prices had dropped in the preceding week. And on the morning of Oct. 19, a graphic in The Wall Street Journal explicitly compared prices from 1922 through 1929 with those from 1980 through 1987. The declines that had already occurred in October 1987 looked a lot like those that had occurred just before the October 1929 stock market crash. That graphic in the leading financial paper, along with an article that accompanied it, raised the thought that today, yes, this very day could be the beginning of the end for the stock market. It was one factor that contributed to a shift in mass psychology. As I’ve said in a previous column, markets move when other investors believe they know what other investors are thinking. In short, my survey indicated that Oct. 19, 1987, was a climax of disturbing narratives. It became a day of fast reactions amid a mood of extreme crisis in which it seemed that no one knew what was going on and that you had to trust your own gut feelings. Given the state of communications then, it is amazing how quickly the panic spread. As my respondents told me on their questionnaires, most people learned of the market plunge through direct word of mouth. I first heard that the market was plummeting while lecturing to my morning class at Yale. A student in the back of the room was listening to a miniature transistor radio with an earphone, and interrupted me to tell us all about the market. Right after class, I walked to my broker’s office at Merrill Lynch in downtown New Haven, to assess the mood there. My broker appeared harassed and busy, and had time enough only to say, “Don’t worry!” He was right for long-term investors: The market began rising later that week, and in retrospect, stock charts show that buy-and-hold investors did splendidly if they stuck to their strategies. But that’s easy to say now. Like the 2016 airport stampede, the 1987 stock market fall was a panic caused by fear and based on rumors, not on real danger. In 1987, a powerful feedback loop from human to human — not computer to computer — set the market spinning. Such feedback loops have been well documented in birds, mice, cats and rhesus monkeys. And in 2007 the neuroscientists Andreas Olsson, Katherine I. Nearing and Elizabeth A. Phelps described the neural mechanisms at work when fear spreads from human to human. We will have panics but not an exact repeat of Oct. 19, 1997. In one way, the situation has probably gotten worse: Technology has made viral rumor transmission much easier. But there are regulations in place that were intended to forestall another one-day market collapse of such severity. In response to the 1987 crash and the Brady Commission report, the New York Stock Exchange instituted Rule 80B, a “circuit breaker” that, in its current amended form, shuts down trading for the day if the Standard & Poor’s 500-stock index falls 20 percent from the previous close. That 20 percent threshold is interesting: Regulators settled on a percentage decline just a trifle less than the one that occurred in 1987. That choice may have been an unintentional homage to the power of narratives in that episode. But 20 percent would still be a big drop. Many people believe that stock prices are already very high, and if the right kinds of human interactions build in a crescendo, we could have another monumental one-day decline. One-day market drops are not the greatest danger, of course. The bear market that started during the financial crisis in 2007 was a far more consequential downturn, and it took months to wend its way toward a market bottom in March 2009. That should not be understood as a prediction that the market will have another great fall, however. It is simply an acknowledgment that such events involve the human psyche on a mass scale. We should not be surprised if they occur or even if, for a protracted period, the market remains remarkably calm. We are at risk, but with luck, another perfect storm — like the one that struck on Oct. 19, 1987 — might not happen in the next 30 years. Robert J. Shiller is Sterling Professor of Economics at Yale. by R. Christopher Whalen October 16, 2017 The Hague | Almost as soon as it started, the excitement surrounding earnings for financials in Q3 2017 dissipated like air leaving a balloon. Results for the largest banks – including JPMorgan (NYSE:JPM), Citigroup (NYSE:C) and Wells Fargo (NYSE:WFC) – all universally disappointed, even based upon the admittedly modest expectations of the Sell Side analyst cohort. Bank of America (NYSE:BAC), the best performing stock in the large cap group (up 60% in the past year), disappointed with a $100 million charge for legacy mortgage issues. Despite strong loan growth, year-over-year BAC's net revenue is up about 5% but actually fell in the most recent period compared with Q2 '17. As with many other sectors, in large-cap financials there was little excitement, no alpha -- just slightly higher loss rates on loan portfolios that are growing high single-digits YOY. Yet equity valuations are up mid-double digits over the same period. The explanation for this remarkable divergence between stock prices and the underlying performance of public companies lies with the Federal Open Market Committee. Low interest rates and the extraordinary expansion of the Fed's balance sheet have driven asset prices up by several orders of magnitude above the level of economic growth. Meanwhile across the largely vacant floor of the New York Stock Exchange, traders puzzled over the latest management changes at General Electric Co (NYSE:GE), the once iconic symbol of American industrial prowess. Over the past year, GE's stock price has slumped by more than 20% even with the Fed's aggressive asset purchases and low rate policies. Just imagine where GE would be trading without Janet Yellen. To be fair, though, much of GE’s reputation in the second half of the 20th Century came about because of financial machinations more than the rewards of industry. A well-placed reader of The IRA summarizes the rise and fall of the company built by Thomas Edison: “For years under Welch, GE made its money from GE Capital and kept the industrial business looking good by moving costs outside the US via all kinds of financial engineering. Immelt kept on keeping on. That didn't change until it had to with the financial crisis. No matter what, untangling that kind of financial engineering spaghetti is for sure and has been a decade long process. No manager survives presiding over that. Jeffrey Immelt is gone.” Those transactions intended to move costs overseas also sought to move tax liability as well, one reason that claims in Washington about “overtaxed” US corporations are so absurd. Readers will recall our earlier discussion of the decision by the US Supreme Court in January not to hear an appeal by Dow Chemical over a fraudulent offshore tax transaction. The IRS also caught GE playing the same game. Indeed, US corporations have avoided literally tens of trillions of dollars in taxes over the past few decades using deceptive offshore financial transactions. Of note, the Supreme Court’s decision not to hear the appeal by Dow Chemical leaves offending US corporations no defense against future IRS tax claims. Like other examples of American industrial might such as IBM (NYSE:IBM), GE under its new leader John Flannery seems intent upon turning the company into a provider of software. Another reader posits that “they’re going to spend a decade selling the family silver to maintain a dividend and never make the conversion they would like and never get the multiple they want. GE is dead money at a 4% yield, which given some investors objectives – retirees and the like -- might not be such a bad thing.” The question raised by several observers is whether the departure of Immelt signals an even more aggressive “value creation” effort at GE that could lead to the eventual break-up of the company. Like General Motors (NYSE:GM), GE has been undergoing a decades long process of rationalizing its operations to fit into a post-war (that is, WWII) economy where global competition is the standard and the US government cannot guarantee profits or market share or employment for US workers. GE's decision this past June to sell the Edison-era lighting segment illustrates the gradual process of liquidation of the old industrial business. Henry Ford observed that Edison was America’s greatest inventor and worst businessman, an observation confirmed by the fact that Edison’s personal business fortunes declined after selling GE. In fact, the great inventor died a pauper. And of the dozen or so firms that were first included in the Dow Jones Industrial Average over a century ago, GE is the only name from that group that remains today. But the pressure on corporate executives to repurchase shares or sell business lines to satisfy the inflated return expectations of institutional investors is not just about good business management. The expectations of investors also reflect relative returns and asset prices, which are a function of the decisions made in Washington by the FOMC. Fed Chair Janet Yellen may think that the US economy is doing just fine, but in fact the financial sector has never been so grotesquely distorted as it is today. Let’s wind the clock back two decades to December 1996. The Labor Department had just reported a “blowout” jobs report. Then-Federal Reserve chairman Alan Greenspan had just completed a decade in office. He made a now famous speech at American Enterprise Institute wherein Greenspan asked if "irrational exuberance" had begun to play a role in the increase of certain asset prices. He said: “Clearly, sustained low inflation implies less uncertainty about the future, and lower risk premiums imply higher prices of stocks and other earning assets. We can see that in the inverse relationship exhibited by price/earnings ratios and the rate of inflation in the past. But how do we know when irrational exuberance has unduly escalated asset values, which then become subject to unexpected and prolonged contractions as they have in Japan over the past decade? And how do we factor that assessment into monetary policy? We as central bankers need not be concerned if a collapsing financial asset bubble does not threaten to impair the real economy, its production, jobs, and price stability. Indeed, the sharp stock market break of 1987 had few negative consequences for the economy. But we should not underestimate or become complacent about the complexity of the interactions of asset markets and the economy. Thus, evaluating shifts in balance sheets generally, and in asset prices particularly, must be an integral part of the development of monetary policy.” In the wake of the 2008 financial crisis, the FOMC abandoned its focus on the productive sector and essentially substituted exuberant monetary policy for the irrational behavior of investors in the roaring 2000s. In place of banks and other intermediaries pushing up assets prices, we instead have seen almost a decade of “quantitative easing” by the FOMC doing much the same thing. And all of this in the name of boosting the real economy? The Federal Reserve System, joined by the Bank of Japan and the European Central Bank, artificially increased assets prices in a coordinated effort not to promote growth, but avoid debt deflation. Unfortunately, without an increase in income to match the artificial rise in assets prices, the logical and unavoidable result of the end of QE is that asset prices must fall and excessive debt must be reduced. Stocks, commercial real estate and many other asset classes have been vastly inflated by the actions of global central banks. Assuming that these central bankers actually understand the implications of their actions, which are nicely summarized by Greenspan’s remarks some 20 years ago, then the obvious conclusion is that there is no way to “normalize” monetary policy without seeing a significant, secular decline in asset prices. The image below illustrates the most recent meeting of the FOMC. The lesson for investors is that much of the picture presented today in prices for various assets classes is an illusion foisted upon us all by reckless central bankers. Yellen and her colleagues seem to think that they can spin straw into gold by manipulating markets and asset prices. As Chairman Greenspan noted, however, “evaluating shifts in balance sheets generally, and in asset prices particularly, must be an integral part of the development of monetary policy.” While you may think less of Chairman Greenspan for his role in causing the 2008 financial crisis, the fact remains that he understands markets far better than the current cast of characters on the FOMC. Yellen and her colleagues pray to different gods in the pantheon of monetary mechanics. As investors ponder the future given the actions of the FOMC under Yellen, the expectation should be that normalization, if and when it occurs, implies lower returns and higher volatility in equal proportion to the extraordinary returns and record low volatility of the recent past. Evans-Pritchard - BIS discovers $14 trillion of dollar debt offshore, hidden in 'footnotes'25/9/2017
by Ambrose Evans-Pritchard
17 September, 2017 The world’s top financial watchdog has uncovered $14 trillion of global dollar debt hidden in derivatives and swap contracts, a startling sum that doubles the underlying levels of offshore dollar credit in the international system. The scale of this lending greatly increases the risk of a future funding crisis if inflation ever forces the US Federal Reserve to tighten hard, draining worldwide liquidity and potentially triggering a dollar surge. A forensic study by the Bank for International Settlements says enormous liabilities have accrued through FX swaps, currency swaps, and ‘forwards’. The data is tucked away in the “footnotes” of bank reports. “Contracts worth tens of trillions of dollars stand open and trillions change hands daily. Yet one cannot find these amounts on balance sheets. This debt is, in effect, missing,” said the BIS analysis, written by team under chief economist Claudio Borio. “These transactions are functionally equivalent to borrowing and lending in the cash market. Yet the corresponding debt is not shown on the balance sheet and thus remains obscured,” they wrote in the BIS’s quarterly report. A breath-taking gap in global accounting rules mean that the debt is booked as a notional derivative, “even though it is in effect a secured loan with principal to be repaid in full at maturity.” The hidden lending comes on top of $10.7 trillion of recorded offshore dollar debt outside US jurisdiction. It pushes the combined total to $25 trillion or a third of global GDP. While these contracts serve as a lubricant and hedging device for world commerce, they can be plagued by currency and maturity mismatches. The dollar swaps serve as a ‘money market’ for global finance. Investors often take out short-term contracts that must be rolled over every three months. The great majority have maturities of less than a year. Much of the money is used to make long-term investments in illiquid assets, the time-honoured cause of financial of financial blow-ups. “Even sound institutional investors may face difficulties. If they have trouble rolling over their hedges, they could be forced into fire sales,” said the Swiss-based watchdog. While the BIS is careful to talk in broad terms, it is known that Chinese developers have borrowed heavily in US dollars through the FX swaps market. They do so because rates are lower and to dodge credit curbs. If funding suddenly dries up, Chinese regulators may be reluctant to bail them out for political reasons - until the situation is very serious. “A defining question for the global economy is how vulnerable balance sheets may be to higher interest rates,” said Mr Borio, the High Priest of the global banking fraternity. Signs of excess are visible everywhere. “Corporate debt is now considerably higher than it was pre-crisis. Leverage indicators have reached levels reminiscent of those that prevailed during previous corporate credit booms. A growing share of firms face interest expenses exceeding earnings before interest and taxes,” said the report. The BIS warned that margin debt used on equity markets exceeds the dotcom extreme in 2000. So-called ‘leveraged loans’ have surged to a record $1 trillion, and the share with risky ‘covenant-lite’ terms have jumped to 75pc. Everything looks fine so long as low bond yields underpin the asset edifice, but they may not stay low. “Equity markets continue to be vulnerable to the risk of a snapback in bond markets,“ it said. The structure is deeply unhealthy. Central bankers dare not lift rates despite economic recovery because of what they might detonate. “There is a certain circularity that points to the risk of a debt trap,” said Mr Borio. The Achilles Heel is global dollar debt. It was a seizure of the offshore dollar capital markets in late 2008 that turned the Lehman and AIG bankruptcies into a global event, and came close to bringing down the European banking system. “The meltdown in dollar-denominated structured products caused funding markets to seize up and banks to scramble for dollars. Markets calmed only after coordinated central bank swap lines to supply dollars,” said the BIS. The Fed effectively saved Europe from disaster. It is an open question whether the US Treasury would authorize such a rescue under the Trump Administration. The Sword of Damocles still hangs precariously a decade later. Global dependence on dollar liquidity has since become even more extreme. Over 90pc of all FX swaps and forwards worldwide today are in US currency. The dollar is even used within Europe for most swaps involving the Polish zloty or the Swedish krona for example, a pattern that would probably astonish European politicians. “The dollar reigns supreme,” said the BIS. What is odd is that Asian central banks and European multilateral bodies are huge players in this trade, effectively aiding and abetting a dangerous game. The message from a string of BIS reports is that the US dollar is both the barometer and agent of global risk appetite and credit leverage. Episodes of dollar weakness - such as this year - flush the world with liquidity and nourish asset booms. When the dollar strengthens, it becomes a headwind for stock markets and credit. If the dollar spikes violently, it sets off global tremors and a credit squeeze in emerging markets. This is what could happen again if President Trump’s tax reform plans lead to a big fiscal expansion and a repatriation of trillions of US corporate cash held overseas. Currency analysts say it would be an emerging market bloodbath. While the ‘fragile five’ - India, South Africa, Indonesia, Turkey, Brazil - have mostly cut their current account deficits and are in better shape than during the ‘taper tantrum’ of 2013, the problem has rotated to oil producers. China’s corporate debt has soared to vertiginous levels. Recorded dollar debt in emerging markets has doubled to $3.4 trillion in a decade, without including the hidden swaps. Local currency borrowing has risen by leaps and bounds. They are no longer low-debt economies. The BIS credit gap indicator of banking risk is flashing a red alert for Hong Kong, reaching 35pc of GDP. While it has dropped to 22.1pc in China, the country is still in the danger zone. Any sustained reading above 30 is a warning signal for a banking crisis three years later. Canada is also vulnerable at 11.3. Turkey (9.7) and Thailand (9) are on the edge. Most would be in trouble if global borrowing rose by 250 basis points. The UK is well-behaved on the credit gap metric. That is small comfort. There will be nowhere to hide if the world ever faces a dollar ‘margin call’. Shiller - The US stock market looks like it did before most of the previous 13 bear markets23/9/2017
by Robert Shiller Project Syndicate September 22, 2017 The U.S. stock market today is characterized by a seemingly unusual combination of very high valuations, following a period of strong earnings growth, and very low volatility. What do these ostensibly conflicting messages imply about the likelihood that the United States is headed toward a bear market in stocks SPX, -0.04% ? To answer that question, we must look to past bear markets. And that requires us to define precisely what a bear market entails. The media nowadays delineate a “classic” or “traditional” bear market as a 20% decline in stock prices. That definition does not appear in any media outlet before the 1990s, and there has been no indication of who established it. It may be rooted in the experience of Oct. 19, 1987, when the stock market dropped by just over 20% in a single day. Attempts to tie the term to the “Black Monday” story may have resulted in the 20% definition, which journalists and editors probably simply copied from one another. Origin of the ‘20%’ figure In any case, that 20% figure is now widely accepted as an indicator of a bear market. Where there seems to be less overt consensus is on the time period for that decline. Indeed, those past newspaper reports often didn’t mention any time period at all in their definitions of a bear market. Journalists writing on the subject apparently did not think it necessary to be precise. In assessing America’s past experience with bear markets, I used that traditional 20% figure, and added my own timing rubric. The peak before a bear market, per my definition, was the most recent 12-month high, and there should be some month in the subsequent year that is 20% lower. Whenever there was a contiguous sequence of peak months, I took the last one. Referring to my compilation of monthly S&P Composite and related data, I found that there have been just 13 bear markets in the U.S. since 1871. The peak months before the bear markets occurred in 1892, 1895, 1902, 1906, 1916, 1929, 1934, 1937, 1946, 1961, 1987, 2000 and 2007. A couple of notorious stock-market collapses — in 1968-70 and in 1973-74 — are not on the list, because they were more protracted and gradual. CAPE ratio Once the past bear markets were identified, it was time to assess stock valuations prior to them, using an indicator that my Harvard colleague John Y. Campbell and I developed in 1988 to predict long-term stock-market returns. The cyclically adjusted price-to-earnings (CAPE) ratio is found by dividing the real (inflation-adjusted) stock index by the average of 10 years of earnings, with higher-than-average ratios implying lower-than-average returns. Our research showed that the CAPE ratio is somewhat effective at predicting real returns over a 10-year period, though we did not report how well that ratio predicts bear markets 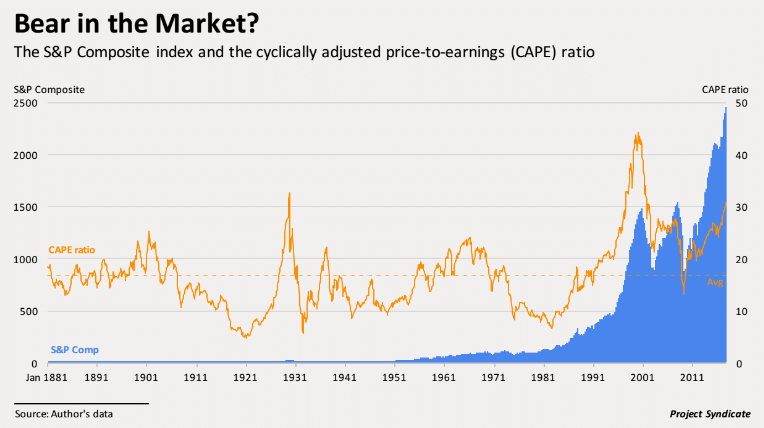 This month, the CAPE ratio in the U.S. is just above 30. That is a high ratio. Indeed, between 1881 and today, the average CAPE ratio has stood at just 16.8. Moreover, it has exceeded 30 only twice during that period: in 1929 and in 1997-2002.
But that does not mean that high CAPE ratios aren’t associated with bear markets. On the contrary, in the peak months before past bear markets, the average CAPE ratio was higher than average, at 22.1, suggesting that the CAPE does tend to rise before a bear market. Moreover, the three times when there was a bear market with a below-average CAPE ratio were after 1916 (during World War I), 1934 (during the Great Depression) and 1946 (during the post-World War II recession). A high CAPE ratio thus implies potential vulnerability to a bear market, though it is by no means a perfect predictor. Earnings to the rescue? To be sure, there does seem to be some promising news. According to my data, real S&P Composite stock earnings have grown 1.8% per year, on average, since 1881. From the second quarter of 2016 to the second quarter of 2017, by contrast, real earnings growth was 13.2%, well above the historical annual rate. But this high growth does not reduce the likelihood of a bear market. In fact, peak months before past bear markets also tended to show high real earnings growth: 13.3% per year, on average, for all 13 episodes. Moreover, at the market peak just before the biggest ever stock-market drop, in 1929-32, 12-month real earnings growth stood at 18.3%. Another piece of ostensibly good news is that average stock-price volatility — measured by finding the standard deviation of monthly percentage changes in real stock prices for the preceding year — is an extremely low 1.2%. Between 1872 and 2017, volatility was nearly three times as high, at 3.5%. Low volatility Yet, again, this does not mean that a bear market isn’t approaching. In fact, stock-price volatility was lower than average in the year leading up to the peak month preceding the 13 previous U.S. bear markets, though today’s level is lower than the 3.1% average for those periods. At the peak month for the stock market before the 1929 crash, volatility was only 2.8%. In short, the U.S. stock market today looks a lot like it did at the peaks before most of the country’s 13 previous bear markets. This is not to say that a bear market is guaranteed: Such episodes are difficult to anticipate, and the next one may still be a long way off. And even if a bear market does arrive, for anyone who does not buy at the market’s peak and sell at the trough, losses tend to be less than 20%. But my analysis should serve as a warning against complacency. Investors who allow faulty impressions of history to lead them to assume too much stock-market risk today may be inviting considerable losses. Robert J. Shiller, a 2013 Nobel laureate in economics and professor of economics at Yale University, is co-author, with George Akerlof, of “Phishing for Phools: The Economics of Manipulation and Deception.” A central chapter from Taleb’s forthcoming book: Skin in the Game by Nassim Nicholas Taleb August 25, 2017 (unedited) Time to explain ergodicity, ruin and (again) rationality. Recall from the previous chapter that to do science (and other nice things) requires survival t not the other way around? 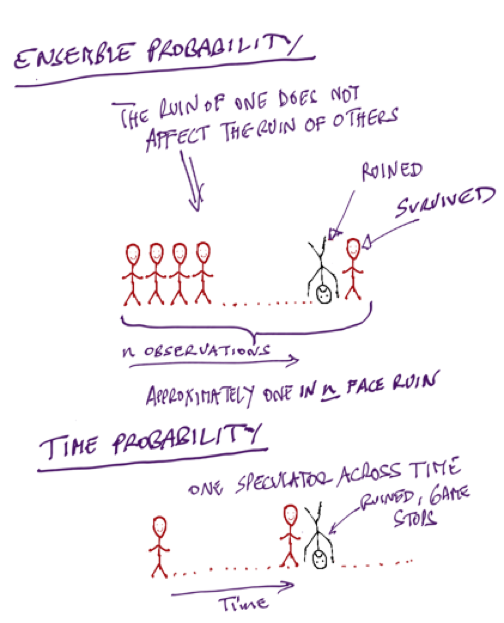 The difference between 100 people going to a casino and one person going to a casino 100 times, i.e. between (path dependent) and conventionally understood probability. The mistake has persisted in economics and psychology since age immemorial. Consider the following thought experiment. First case, one hundred persons go to a Casino, to gamble a certain set amount each and have complimentary gin and tonic –as shown in the cartoon in Figure x. Some may lose, some may win, and we can infer at the end of the day what the “edge” is, that is, calculate the returns simply by counting the money left with the people who return. We can thus figure out if the casino is properly pricing the odds. Now assume that gambler number 28 goes bust. Will gambler number 29 be affected? No. You can safely calculate, from your sample, that about 1% of the gamblers will go bust. And if you keep playing and playing, you will be expected have about the same ratio, 1% of gamblers over that time window. Now compare to the second case in the thought experiment. One person, your cousin Theodorus Ibn Warqa, goes to the Casino a hundred days in a row, starting with a set amount. On day 28 cousin Theodorus Ibn Warqa is bust. Will there be day 29? No. He has hit an uncle point; there is no game no more. No matter how good he is or how alert your cousin Theodorus Ibn Warqa can be, you can safely calculate that he has a 100% probability of eventually going bust. The probabilities of success from the collection of people does not apply to cousin Theodorus Ibn Warqa. Let us call the first set ensemble probability, and the second one time probability (since one is concerned with a collection of people and the other with a single person through time). Now, when you read material by finance professors, finance gurus or your local bank making investment recommendations based on the long term returns of the market, beware. Even if their forecast were true (it isn’t), no person can get the returns of the market unless he has infinite pockets and no uncle points. The are conflating ensemble probability and time probability. If the investor has to eventually reduce his exposure because of losses, or because of retirement, or because he remarried his neighbor’s wife, or because he changed his mind about life, his returns will be divorced from those of the market, period. We saw with the earlier comment by Warren Buffett that, literally, anyone who survived in the risk taking business has a version of “in order to succeed, you must first survive.” My own version has been: “never cross a river if it is on average four feet deep.” I effectively organized all my life around the point that sequence matters and the presence of ruin does not allow cost-benefit analyses; but it never hit me that the flaw in decision theory was so deep. Until came out of nowhere a paper by the physicist Ole Peters, working with the great Murray Gell-Mann. They presented a version of the difference between the ensemble and the time probabilities with a similar thought experiment as mine above, and showed that about everything in social science about probability is flawed. Deeply flawed. Very deeply flawed. For, in the quarter millennia since the formulation by the mathematician Jacob Bernoulli, and one that became standard, almost all people involved in decision theory made a severe mistake. Everyone? Not quite: every economist, but not everyone: the applied mathematicians Claude Shannon, Ed Thorp, and the physicist J.-L. Kelly of the Kelly Criterion got it right. They also got it in a very simple way. The father of insurance mathematics, the Swedish applied mathematician Harald Cramér also got the point. And, more than two decades ago, practitioners such as Mark Spitznagel and myself build our entire business careers around it. (I personally get it right in words and when I trade and decisions, and detect when ergodicity is violated, but I never explicitly got the overall mathematical structure –ergodicity is actually discussed in Fooled by Randomness). Spitznagel and I even started an entire business to help investors eliminate uncle points so they can get the returns of the market. While I retired to do some flaneuring, Mark continued at his Universa relentlessly (and successfully, while all others have failed). Mark and I have been frustrated by economists who, not getting ergodicity, keep saying that worrying about the tails is “irrational”.  Mark Spitznagel explaining (politely) that finance professors are probability challenged Now there is a skin in the game problem in the blindness to the point. The idea I just presented is very, very simple. But how come nobody for 250 years got it? Skin in the game, skin in the game. It looks like you need a lot of intelligence to figure probabilistic things out when you don’t have skin in the game. There are things one can only get if one has some risk on the line: what I said above is, in retrospect, obvious. But to figure it out for an overeducated nonpractitioner is hard. Unless one is a genius, that is have the clarity of mind to see through the mud, or have such a profound command of probability theory to see through the nonsense. Now, certifiably, Murray Gell-Mann is a genius (and, likely, Peters). Gell-Mann is a famed physicist, with Nobel, and discovered the subatomic particles he himself called quarks. Peters said that when he presented the idea to him, “he got it instantly”. Claude Shannon, Ed Thorp, Kelly and Cramér are, no doubt, geniuses –I can vouch for this unmistakable clarity of mind combined with depth of thinking that juts out when in conversation with Thorp. These people could get it without skin in the game. But economists, psychologists and decision-theorists have no genius (unless one counts the polymath Herb Simon who did some psychology on the side) and odds are will never have one. Adding people without fundamental insights does not sum up to insight; looking for clarity in these fields is like looking for aesthetic in the attic of a highly disorganized electrician.  The clarity of the mind of psychogists and economists |
A source of news, research and other information that we consider informative to investors within the context of tail hedging.
The RSS Feed allows you to automatically receive entries
Archives
June 2022
All content © 2011 Lionscrest Advisors Ltd. Images and content cannot be used or reproduced without express written permission. All rights reserved.
Please see important disclosures about this website by clicking here. |
 RSS Feed